Module 1 Lab: Prediction tasks and data framing#
Frame a supervised learning task from raw business or research data.
Lab Context#
This lab uses synthetic tabular observations with features, labels, train/test split, baseline score, and error slices as a safe proxy for the course setting. It is not a substitute for institutional data, but it lets you practice the reasoning, metrics, and documentation pattern before working with real records.
Lab Tasks#
Run the baseline analysis.
Identify the decision the metric supports.
Change one threshold, score weight, or input assumption.
Compare the result before and after your change.
Record one deployment risk that the synthetic data cannot reveal.
import numpy as np
import matplotlib.pyplot as plt
rng = np.random.default_rng(1)
n = 120
feature_a = rng.normal(0, 1, n)
feature_b = rng.normal(0, 1, n)
feature_c = rng.normal(0, 1, n)
linear_score = 0.9*feature_a - 0.5*feature_b + 0.35*feature_c
probability = 1 / (1 + np.exp(-linear_score))
label = (probability > np.quantile(probability, 0.58)).astype(int)
baseline_pred = (feature_a > np.median(feature_a)).astype(int)
model_pred = (linear_score > np.median(linear_score)).astype(int)
baseline_acc = float((baseline_pred == label).mean())
model_acc = float((model_pred == label).mean())
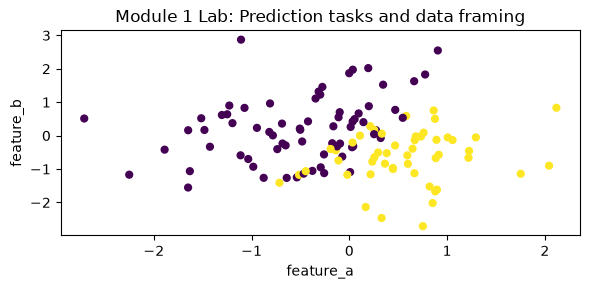
plt.figure(figsize=(6, 3))
plt.scatter(feature_a, feature_b, c=label, cmap="viridis", s=24)
plt.xlabel("feature_a")
plt.ylabel("feature_b")
plt.title("Module 1 Lab: Prediction tasks and data framing")
plt.tight_layout()
{"baseline_accuracy": baseline_acc, "model_accuracy": model_acc, "improvement": model_acc - baseline_acc}
{'baseline_accuracy': 0.8,
 'model_accuracy': 0.9166666666666666,
 'improvement': 0.11666666666666659}
reflection = {
    "what_changed": "",
    "metric_before": "",
    "metric_after": "",
    "interpretation": "",
    "synthetic_data_limit": "",
    "next_real_world_evidence_needed": "",
}
reflection
{'what_changed': '',
 'metric_before': '',
 'metric_after': '',
 'interpretation': '',
 'synthetic_data_limit': '',
 'next_real_world_evidence_needed': ''}